Knowledge Check
Exam-style MCQs aligned with these notes. Available to Hyperexcision Scholar members.
Log in to access
Overview
Classification of bone tumors
Classification Tumors Primary Bone-forming (benign) Osteoma, osteoid osteoma, osteoblastoma Primary Bone-forming (malignant) Osteogenic sarcoma (osteosarcoma) Primary Cartilaginous (benign) Osteochondroma, chondroma, chondroblastoma (enchondroma) Primary Cartilaginous (malignant) Chondrosarcoma Primary Fibrous Non-ossifying fibroma, ossifying fibroma, fibrous dysplasia, desmoplastic fibroma, malignant fibrous histiocytoma Primary Vascular Hemangioendothelioma, hemangiopericytoma, angiosarcoma Others Giant cell tumor (osteoclastoma), bone cyst, Ewing sarcoma, adamantinoma, and chordoma
Most common bone tumors by age group
Age group Common tumors Paediatric Ewing sarcoma, osteogenic sarcoma (osteosarcoma) Adult Metastasis to bone, multiple myeloma , lymphoma , sarcoma of soft tissue
Bone tumors by location
Location Tumors Skull Eosinophilic granuloma, metastasis, myeloma Mandible Adamantinoma, dentogenic cyst Humerus All tumors, simple bone cysts Ribs Metastases, enchondroma, chondrosarcoma, Ewing’s sarcoma Spine Metastases, myeloma, osteoblastoma, chordoma, hemangioma, aneurysmal bone cyst Pelvis Osteosarcoma, chondrosarcoma, simple bone cyst, lymphoma , Ewing’s sarcoma, and chordoma Distal radius Giant cell tumor, eosinophilic granuloma Hands Enchondroma Proximal femur Simple bone cyst, fibrous dysplasia, enchondroma, Ewing sarcoma, eosinophilic granuloma Around the knee All tumors, osteosarcoma, Ewing’s sarcoma Tibia shaft Non-ossifying fibroma, fibrous dysplasia, adamantinoma, osteoid osteoma Calcaneus Simple bone cyst, Ewing’s sarcoma, osteoblastoma, chondroblastoma
Warning signs for bone tumors
Unremitting bone or joint pain (especially pain that wakes the patient from sleep)Rapid progression of bone or joint pain , growth, or swellingConstitutional symptoms : fever, chills, shortness of breath, night sweats, and weight lossMultiple areas of involvement
Approach to imaging
Which bone is affected?
Different locations have different tumors
Is the patient skeletally mature or immature?
Has the epiphysis and metaphysis fused?
Where is the lesion located?
At the epiphysis, metaphysis, or diaphysis?
Central or eccentric?
Cortical or medullary?
What are the margins ?
Well-defined or poorly defined
What is the zone of transition?
Geographic zone of transition = well-circumscribed with or without a sclerotic border
Moth-eaten zone of transition = poorly-defined (difficult to determine where the lesion begins and normal bone ends)
Permeative zone of transition = barely perceptible
What matrix is present?
Ground-glass appearance (immature woven bone)
Osteoid (bone-like, appears as clouds)
Chondroid (cartilage-like, appears as rings and arcs)
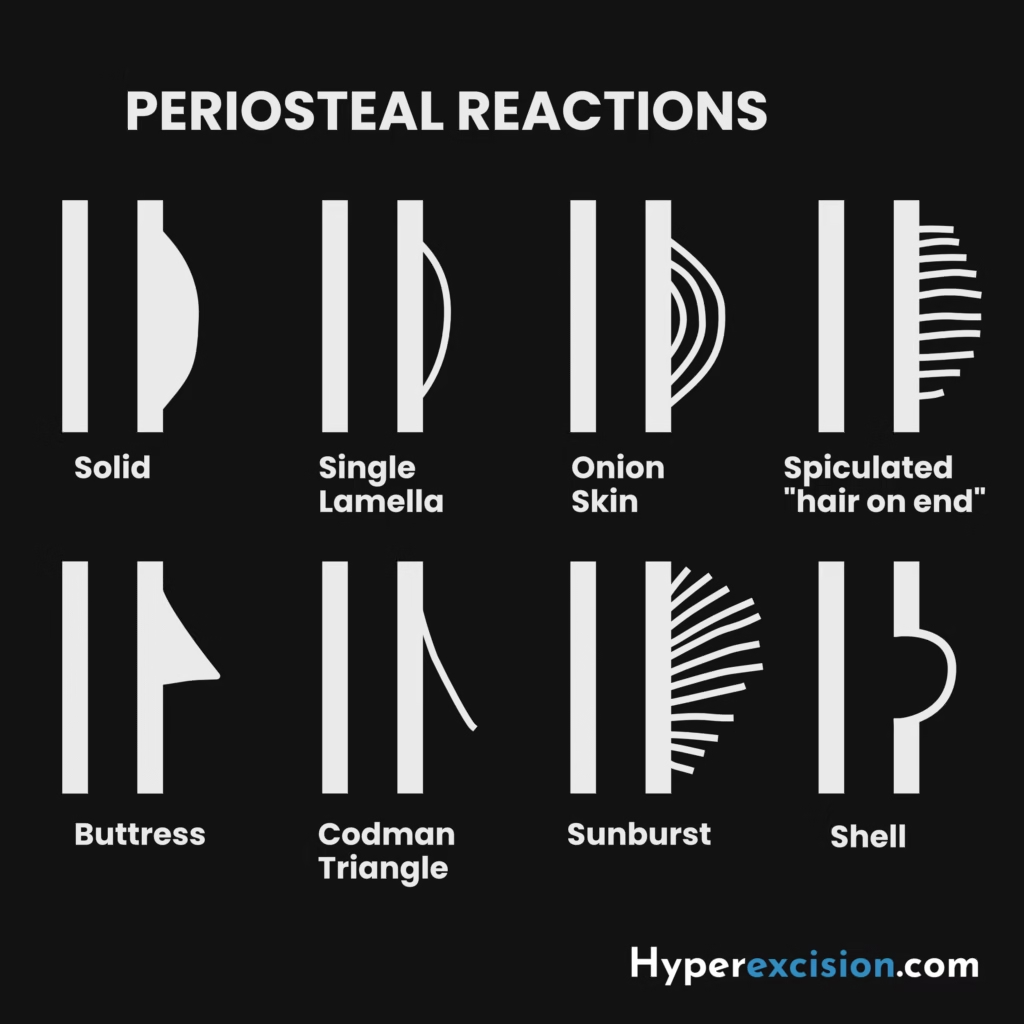
What is the periosteal reaction ?
Onion skin (multi-layered)
Codman’s triangle
Hair-on end (spicullated)
Sunburst
Is there soft tissue involvement? Is the lesion solitary, or are there multiple lesions?
Multiple tumors occur in metastases and fibrous dysplasia
Periosteal reactions MSTS (Enneking) Tumor Staging
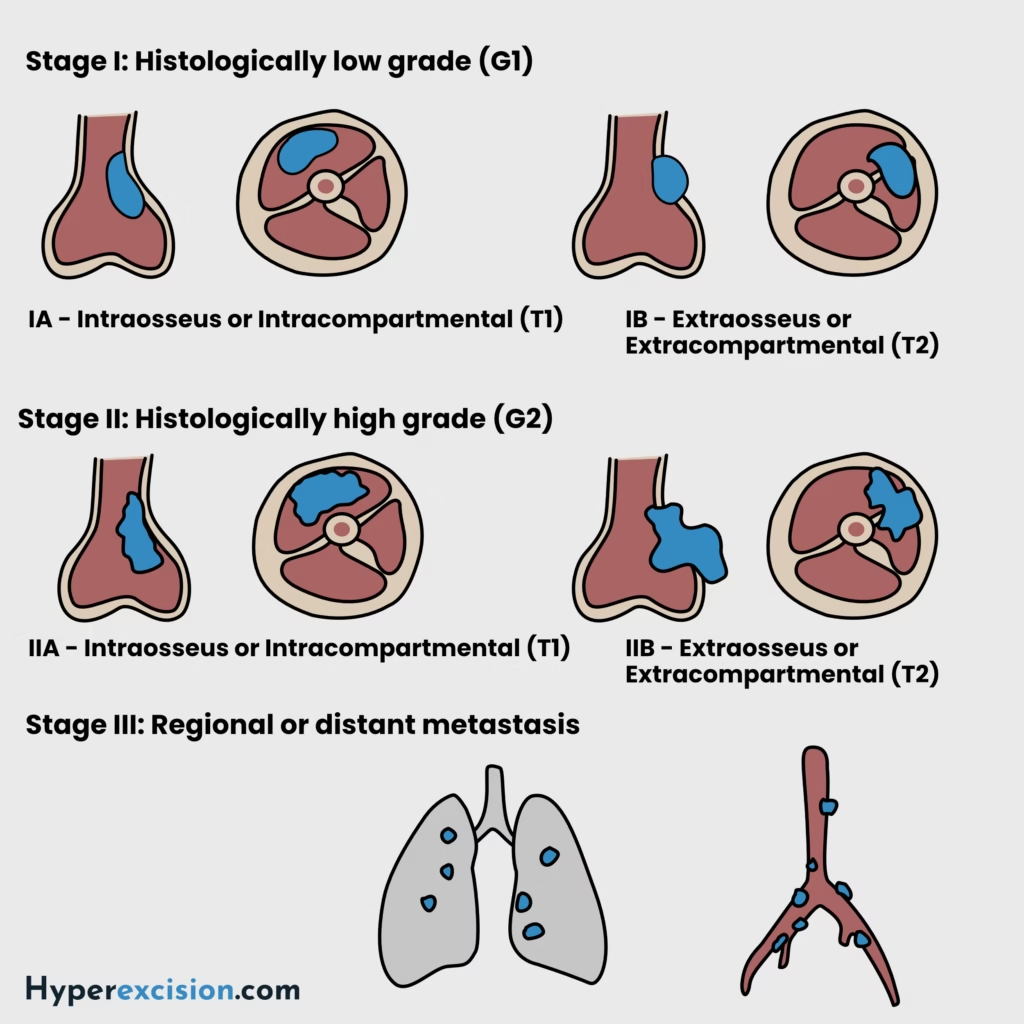
Enneking tumor staging involves tumor grade, local spread (intra- or extracompartmental), and metastatic spread
Stage Grade Site Metastasis IA Low grade T1 – intracompartmental M0 IB Low grade T2 – extracompartmental M0 IIA High grade T1 – intracompartmental M0 IIB High grade T2 – extracompartmental M0 III Metastatic T1 or T2 intracompartmental or extracompartmental M1
Enneking Staging
Biochemistry
ACTH P: <80 ng/L ALT P: 5–35 U/L Albumin P: 35–50 g/L Aldosterone P: 100–500 pmol/L Alk. phosphatase P: 30–130 U/L α-Amylase P: 0–180 IU/dL α-Fetoprotein S: <10 kU/L Angiotensin II P: 5–35 pmol/L ADH P: 0.9–4.6 pmol/L AST P: 5–35 U/L Bicarbonate P: 24–30 mmol/L Bilirubin P: 3–17 μmol/L BNP P: <50 ng/L CRP P: <10 mg/L Calcitonin P: <0.1 mcg/L Calcium (ionized) P: 1.0–1.25 mmol/L Calcium (total) P: 2.12–2.60 mmol/L Chloride P: 95–105 mmol/L Cholesterol P: <5.0 mmol/L VLDL P: 0.128–0.645 mmol/L LDL P: <2.0 mmol/L HDL P: 0.9–1.93 mmol/L Cortisol AM P: 450–700 nmol/L Cortisol Midnight P: 80–280 nmol/L CK ♂ P: 25–195 U/L CK ♀ P: 25–170 U/L Creatinine P: 70–100 μmol/L Ferritin P: 12–200 mcg/L Folate S: 2.1 mcg/L FSH P: 2–8 U/L ♂; >25 menopause GGT ♂ P: 11–51 U/L GGT ♀ P: 7–33 U/L Glucose (fasting) P: 3.5–5.5 mmol/L Growth hormone P: <20 mu/L HbA1C (DCCT) B: 4–6% HbA1C (IFCC) B: 20–42 mmol/mol Iron ♂ S: 14–31 μmol/L Iron ♀ S: 11–30 μmol/L Lactate (venous) P: 0.6–2.4 mmol/L Lactate (arterial) P: 0.6–1.8 mmol/L LDH P: 70–250 U/L LH P: 3–16 U/L Magnesium P: 0.75–1.05 mmol/L Osmolality P: 278–305 mosmol/kg PTH P: 0.8–8.5 pmol/L Potassium P: 3.5–5.3 mmol/L Prolactin ♂ P: <450 U/L Prolactin ♀ P: <600 U/L PSA P: 0–4 mcg/mL Protein (total) P: 60–80 g/L Red cell folate B: 0.36–1.44 μmol/L Renin (erect) P: 2.8–4.5 pmol/mL/h Renin (recumbent) P: 1.1–2.7 pmol/mL/h Sodium P: 135–145 mmol/L TBG P: 7–17 mg/L TSH P: 0.5–4.2 mU/L T4 P: 70–140 nmol/L Free T4 P: 9–22 pmol/L TIBC S: 54–75 μmol/L Triglycerides P: 0.50–2.3 mmol/L T3 P: 1.2–3.0 nmol/L Troponin T P: <0.1 mcg/L Urate ♂ P: 210–480 μmol/L Urate ♀ P: 150–390 μmol/L Urea P: 2.5–6.7 mmol/L Vitamin B12 S: 0.13–0.68 nmol/L Vitamin D S: 50 nmol/L
Arterial Blood Gases
pH 7.35–7.45 PaCO₂ 4.7–6.0 kPa PaO₂ >10.6 kPa Base excess ±2 mmol/L
Urine
Cortisol (free) <280 nmol/24h Hydroxyindole acetic acid 16–73 μmol/24h Hydroxymethylmandelic acid 16–48 μmol/24h Metanephrines 0.03–0.69 μmol/mmol cr. Osmolality 350–1000 mosmol/kg 17-Oxogenic steroids ♂ 28–30 μmol/24h 17-Oxogenic steroids ♀ 21–66 μmol/24h 17-Oxosteroids ♂ 17–76 μmol/24h 17-Oxosteroids ♀ 14–59 μmol/24h Phosphate (inorganic) 15–50 mmol/24h Potassium 14–120 mmol/24h Protein <150 mg/24h Protein/creatinine ratio <3 mg/mmol Sodium 100–250 mmol/24h
Haematology
WCC 4.0–11.0 ×10⁹/L RBC ♂ 4.5–6.5 ×10¹²/L RBC ♀ 3.9–5.6 ×10¹²/L Hb ♂ 130–180 g/L Hb ♀ 115–160 g/L PCV ♂ 0.4–0.54 L/L PCV ♀ 0.37–0.47 L/L MCV 76–96 fL MCH 27–32 pg MCHC 300–360 g/L RDW 11.6–14.6% Neutrophils 2.0–7.5 ×10⁹/L (40–75%) Lymphocytes 1.0–4.5 ×10⁹/L (20–45%) Eosinophils 0.04–0.44 ×10⁹/L (1–6%) Basophils 0–0.10 ×10⁹/L (0–1%) Monocytes 0.2–0.8 ×10⁹/L (2–10%) Platelets 150–400 ×10⁹/L Reticulocytes 0.8–2.0% / 25–100 ×10⁹/L Prothrombin time 10–14 s APTT 35–45 s
Paediatric
Pulse Rate (bpm) Neonate 140–160 Infant <1yr 120–140 1–5 years 110–130 5–12 years 80–120 >12 years 70–100 Respiratory Rate (tachypnoea) 0–2 months ≥60/min 2–12 months ≥50/min 1–5 years ≥40/min >5 years ≥30/min Blood Pressure (mmHg) Term 65/45 1 year 75/50 4 years 85/60 8 years 95/65 10 years 100/70 Weight Formulas 3–12 months (a + 9)/2 kg 1–6 years 2a + 8 kg >6 years (7a − 5)/2 kg Haemoglobin (g/dL) Term newborn 13–20 1 month 11–18 2 months 10–15 1–2 years 10–13 >2 years 11–14 MUAC (6 months–5 years) Obese >17.5 cm Normal 13.5–17.4 cm At risk 12.5–13.4 cm Moderate malnutrition 11.5–12.4 cm Severe malnutrition <11.5 cm Developmental Milestones Social smile 1.5 months Head control 4 months Sits unsupported 7 months Crawls 10 months Stands unsupported 10–12 months Walks 12–13 months Talks 18 months CSF WBC (/mm³) Term newborn 0–25 >2 weeks 0–5