Hypertensive Retinopathy

Last updated: November 13, 2024

Overview

Hypertensive Retinopathy is a disease of the retinal and choroidal vasculature due to severe acute or chronic hypertension.

Chronic hypertensive retinopathy is more common and is predominantly seen in older patients.

Disease ProcessCausePatients
Acute hypertensive retinopathySudden, severe hypertension (commonly secondary hypertension)Patients of any age
Chronic hypertensive retinopathyLongstanding hypertension and atherosclerosis. Atherosclerosis causes retinal arterioles to expand and compress venules leading to branch retinal vein occlusion.Older patients
  • Regulation of the retinal and choroidal vasculature
    • The retinal vasculature is autoregulated. It loses it autoregulation as diastolic blood pressure exceeds 110-115 mmHg.
    • The choroidal vasculature is regulated by the sympathetic nervous system

Acute Hypertensive Retinopathy

Acute hypertensive retinopathy is seen in patients with hypertensive crisis (BP > 200/110). Elevated blood pressure damages the retinal and choroidal blood vessels through fibrinoid necrosis and ischemic necrosis.

  • Ophthalmoscopic findings
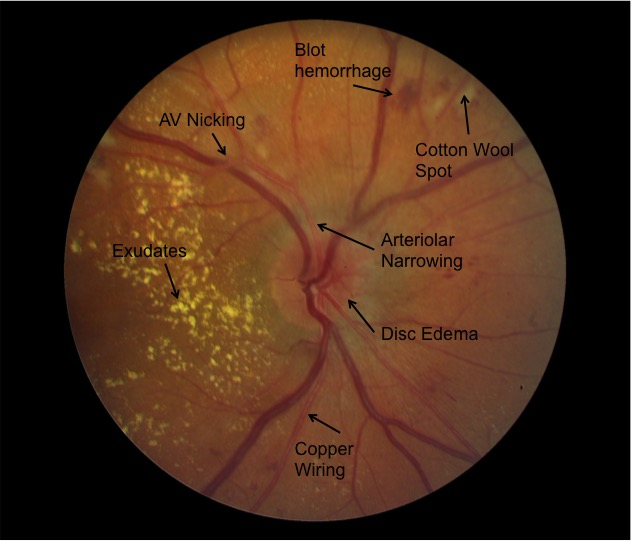
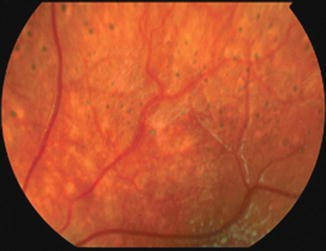
    • Cotton wool spots: Ischemia to nerve fibers
    • Uniform narrowing of arterioles and Tortuosity: uniform narrowing since all vessels are affected (unlike in chronic hypertensive retinopathy)
    • Flame hemorrhages and dot blot hemorrhages: Necrosis and bleeding
    • Papilledema (disc edema): Leakage from the arterioles supplying the optic disk. The optic disk appears confluent with the rest of the retina.
    • Elsching spots: Damage to the retinal pigment epithelium
  • Treatment
    • Manage the hypertensive crisis.
    • Avoid a steep reduction in BP as it can worsen damage
  • Complications
    • Retinal detachment: Due to damage and exudates in the choroid and Retinal pigment epithelium. Causes traction/exudative retinal detachment. Signs and symptoms – Acute change in vision, photopsia, floaters
    • Optic neuropathy: ischemia of the optic nerve head due to vasoconstriction. Signs and symptoms – blurred disk margin, papilledema, flame hemorrhages
Fundoscopy findings in Hypertensive Retinopathy
Elsching spots

Chronic Hypertensive Retinopathy

Chronic hypertensive retinopathy is an end-organ manifestation of hypertension. Chronic hypertension accelerates the development of atherosclerosis. Atherosclerosis decreases the radius of arterioles. These arterioles expand to down-regulate resistance to flow and as the expand they compress the venules. Advanced forms of chronic hypertensive retinopathy causes a loss in visual acuity.

  • Risk factors for chronic hypertensive retinopathy
    • Age
    • Black race
    • FHx
    • Smoking
    • Obesity
    • Stress
    • Sedentary lifestyle
    • Excessive alcohol consumption
  • What additional risks do patients with chronic hypertensive retinopathy have?
  • Ophthalmoscopic findings
    • Focal to Uniform narrowing of the arterioles
    • AV nicking and AV crossing: due to arterioles compressing the venules. This is a hallmark finding of chronic hypertensive retinopathy
    • Flame hemorrhage and dot-blot hemorrhage
    • Copper-wiring and silver wiring: narrowing of the vascular lumen due to atherosclerosis
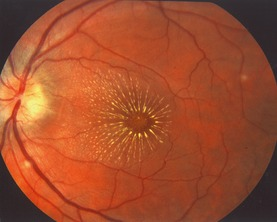
    • Macula star: exudation around the macula in advanced chronic hypertensive retinopathy
  • Treatment
  • Complications
    • Branch retinal vein occlusion/ Central retinal vein occlusion: due to AV nicking/occlusion
    • Retinal detachment: due to vascular fibrosis (tractional RD)
    • Optic nerve atrophy: due to chronic optic disk swelling. Leads to decreased visual acuity.
AV crossing, AV nicking, copper wiring and silver wiring seen in chronic hypertensive retinopathy. Source- American Academy of Opthalmology
Macula star
Reference Intervals
Biochemistry
ACTHP: <80 ng/L
ALTP: 5–35 U/L
AlbuminP: 35–50 g/L
AldosteroneP: 100–500 pmol/L
Alk. phosphataseP: 30–130 U/L
α-AmylaseP: 0–180 IU/dL
α-FetoproteinS: <10 kU/L
Angiotensin IIP: 5–35 pmol/L
ADHP: 0.9–4.6 pmol/L
ASTP: 5–35 U/L
BicarbonateP: 24–30 mmol/L
BilirubinP: 3–17 μmol/L
BNPP: <50 ng/L
CRPP: <10 mg/L
CalcitoninP: <0.1 mcg/L
Calcium (ionized)P: 1.0–1.25 mmol/L
Calcium (total)P: 2.12–2.60 mmol/L
ChlorideP: 95–105 mmol/L
CholesterolP: <5.0 mmol/L
VLDLP: 0.128–0.645 mmol/L
LDLP: <2.0 mmol/L
HDLP: 0.9–1.93 mmol/L
Cortisol AMP: 450–700 nmol/L
Cortisol MidnightP: 80–280 nmol/L
CK ♂P: 25–195 U/L
CK ♀P: 25–170 U/L
CreatinineP: 70–100 μmol/L
FerritinP: 12–200 mcg/L
FolateS: 2.1 mcg/L
FSHP: 2–8 U/L ♂; >25 menopause
GGT ♂P: 11–51 U/L
GGT ♀P: 7–33 U/L
Glucose (fasting)P: 3.5–5.5 mmol/L
Growth hormoneP: <20 mu/L
HbA1C (DCCT)B: 4–6%
HbA1C (IFCC)B: 20–42 mmol/mol
Iron ♂S: 14–31 μmol/L
Iron ♀S: 11–30 μmol/L
Lactate (venous)P: 0.6–2.4 mmol/L
Lactate (arterial)P: 0.6–1.8 mmol/L
LDHP: 70–250 U/L
LHP: 3–16 U/L
MagnesiumP: 0.75–1.05 mmol/L
OsmolalityP: 278–305 mosmol/kg
PTHP: 0.8–8.5 pmol/L
PotassiumP: 3.5–5.3 mmol/L
Prolactin ♂P: <450 U/L
Prolactin ♀P: <600 U/L
PSAP: 0–4 mcg/mL
Protein (total)P: 60–80 g/L
Red cell folateB: 0.36–1.44 μmol/L
Renin (erect)P: 2.8–4.5 pmol/mL/h
Renin (recumbent)P: 1.1–2.7 pmol/mL/h
SodiumP: 135–145 mmol/L
TBGP: 7–17 mg/L
TSHP: 0.5–4.2 mU/L
T4P: 70–140 nmol/L
Free T4P: 9–22 pmol/L
TIBCS: 54–75 μmol/L
TriglyceridesP: 0.50–2.3 mmol/L
T3P: 1.2–3.0 nmol/L
Troponin TP: <0.1 mcg/L
Urate ♂P: 210–480 μmol/L
Urate ♀P: 150–390 μmol/L
UreaP: 2.5–6.7 mmol/L
Vitamin B12S: 0.13–0.68 nmol/L
Vitamin DS: 50 nmol/L
Arterial Blood Gases
pH7.35–7.45
PaCO₂4.7–6.0 kPa
PaO₂>10.6 kPa
Base excess±2 mmol/L
Urine
Cortisol (free)<280 nmol/24h
Hydroxyindole acetic acid16–73 μmol/24h
Hydroxymethylmandelic acid16–48 μmol/24h
Metanephrines0.03–0.69 μmol/mmol cr.
Osmolality350–1000 mosmol/kg
17-Oxogenic steroids ♂28–30 μmol/24h
17-Oxogenic steroids ♀21–66 μmol/24h
17-Oxosteroids ♂17–76 μmol/24h
17-Oxosteroids ♀14–59 μmol/24h
Phosphate (inorganic)15–50 mmol/24h
Potassium14–120 mmol/24h
Protein<150 mg/24h
Protein/creatinine ratio<3 mg/mmol
Sodium100–250 mmol/24h
Haematology
WCC4.0–11.0 ×10⁹/L
RBC ♂4.5–6.5 ×10¹²/L
RBC ♀3.9–5.6 ×10¹²/L
Hb ♂130–180 g/L
Hb ♀115–160 g/L
PCV ♂0.4–0.54 L/L
PCV ♀0.37–0.47 L/L
MCV76–96 fL
MCH27–32 pg
MCHC300–360 g/L
RDW11.6–14.6%
Neutrophils2.0–7.5 ×10⁹/L (40–75%)
Lymphocytes1.0–4.5 ×10⁹/L (20–45%)
Eosinophils0.04–0.44 ×10⁹/L (1–6%)
Basophils0–0.10 ×10⁹/L (0–1%)
Monocytes0.2–0.8 ×10⁹/L (2–10%)
Platelets150–400 ×10⁹/L
Reticulocytes0.8–2.0% / 25–100 ×10⁹/L
Prothrombin time10–14 s
APTT35–45 s
Paediatric
Pulse Rate (bpm)
Neonate140–160
Infant <1yr120–140
1–5 years110–130
5–12 years80–120
>12 years70–100
Respiratory Rate (tachypnoea)
0–2 months≥60/min
2–12 months≥50/min
1–5 years≥40/min
>5 years≥30/min
Blood Pressure (mmHg)
Term65/45
1 year75/50
4 years85/60
8 years95/65
10 years100/70
Weight Formulas
3–12 months(a + 9)/2 kg
1–6 years2a + 8 kg
>6 years(7a − 5)/2 kg
Haemoglobin (g/dL)
Term newborn13–20
1 month11–18
2 months10–15
1–2 years10–13
>2 years11–14
MUAC (6 months–5 years)
Obese>17.5 cm
Normal13.5–17.4 cm
At risk12.5–13.4 cm
Moderate malnutrition11.5–12.4 cm
Severe malnutrition<11.5 cm
Developmental Milestones
Social smile1.5 months
Head control4 months
Sits unsupported7 months
Crawls10 months
Stands unsupported10–12 months
Walks12–13 months
Talks18 months
CSF WBC (/mm³)
Term newborn0–25
>2 weeks0–5
Calculator

Post Discussion

Your email address will not be published. Required fields are marked *